

Is Degen Zoo a Good Investment?
March 16, 2023
How to make money through investing in crypto during a bear market
March 18, 2023How to Do Bitcoin Price Prediction

1. Introduction
In the context of Bitcoin price prediction for 2023, the focus is on how these prices are predicted and how accurate those predictions are. Investment is all about calculation, and the more accurate the calculation, the higher the chance of success.
Firstly, it is important to emphasize that Bitcoin price prediction is extremely significant, as Bitcoin is the leader of the entire cryptocurrency market, much like the stock market index. Bitcoin and Ethereum have distinct differences, with Bitcoin being more pure and decentralized, and unable to be regulated. Ethereum, on the other hand, is the underlying technology and application of the blockchain and is likely to be regulated due to the popularity of its founder, Vitalik Buterin. This leads to Bitcoin attracting more funds and more people holding Bitcoin rather than Ethereum.
However, the rapid development of the entire blockchain industry is due to Ethereum, which has led to Ethereum-based altcoins gradually eating away at Bitcoin’s market share. One thing is certain: if Ethereum is regulated, it will lead to a large amount of funds fleeing from ETH to BTC, which will further increase the price of BTC. The recent incident with Silicon Valley Bank causing USDC and USD to be delisted caused the BTC price to rise, while Ethereum remained unchanged, which illustrates this point well. Web3 is decentralized, and once centralized, it goes against the essence of blockchain, which will undermine the industry.
All of these reasons have led to a phenomenon in the crypto industry: assuming Bitcoin rises by 5%, altcoins listed on CEX will rise by 25% – 50%; if Bitcoin falls by 5%, the same altcoins will fall by 25% – 50%. If Bitcoin is in a long-term bullish market, altcoins will skyrocket. In a Bitcoin bear market, altcoins will plummet. Unless users only want to earn the minimum return, they will not avoid buying altcoins on CEX. Holding altcoins can generate a higher ROI than BTC. Understanding the analysis of Bitcoin’s ups and downs makes its role apparent.
2. The simplest way to predict the rise and fall of Bitcoin
Predicting the rise and fall of Bitcoin has become very difficult with the introduction of various indicators, including professional analysis software such as Glassnode. In fact, predicting doesn’t require such complex analysis software, most of which analyze first-hand data. And even if the answer is given, there has never been an accurate prediction. None. That’s why Bitcoin analysis software cannot accurately predict the price of Bitcoin.
2.1. Current Market Hot Money Situation
In fact, what we want to discuss here is the market economy and overall trend, and the topic is very difficult. After a long period of research, it was discovered that the entire capitalist economy is actually driven by hot money. What is hot money? It can be imagined as the blood of the human body, with liquidity. The blood flows and delivers nutrients to various organs of the body, and the human body stays healthy. If there is anemia, people will faint. The same goes for the entire economy. Hot money allows the entire economy to flow, with businesses taking out loans to do business, users taking out loans to buy cars and houses, repaying them, and constantly circulating. Once hot money is insufficient, businesses cannot get loans, users have no money to buy cars and houses, and various goods from businesses cannot be sold, loans cannot be repaid, and the economy begins to decline. Market hot money, because everyone has the motivation to get something for nothing, so hot money will first flow into the stock market and then towards real estate. The overall rise and fall of the stock market actually indicates how much hot money is currently in the market. This happens before economic growth, and is called a leading indicator. As the cryptocurrency industry becomes more and more like the stock market, the price of Bitcoin rises like stocks and begins to rise before economic growth is evident.
The key point is that the price of Bitcoin will only start to fall after the decrease in hot money. The reason is the time lag between the release and recovery of hot money. The release and recovery of hot money depend mainly on the monetary policy of the Federal Reserve, whether it is hawkish or dovish. Hawkish means raising interest rates, while dovish means not raising interest rates or even cutting them. Before a rate cut, the market knows that prices will rise, so many users buy Bitcoin in order to earn profits after the rate cut. Therefore, even though hot money has not yet been released, the price of Bitcoin is pushed up because many users have already purchased it. After the release of hot money, the second wave of users buys in, but the actual price has already gone up. It takes about 6 months for the economy to digest the hot money, and then the economic growth will be reflected. That’s why economic growth is a leading indicator for both the overall stock market and the price of Bitcoin.
When hot money is recovered, i.e., when the Federal Reserve is about to turn hawkish, individual investors cannot perceive the effect of a rate hike quickly. This is like driving at high speed on a highway, where stepping on the brakes can cause a crash, so one needs to slow down instead. This slowdown is manifested when the Federal Reserve announces a rate hike, and institutions sell Bitcoin at high prices, causing the price to fall. Then, individual investors see the price drop and think it’s a good opportunity to “bottom out” and buy in at this price. As the market’s hot money is recovered, corporate revenue decreases, user income decreases, and Bitcoin begins its second round of decline. This effect is called the “hook” effect. Therefore, understanding the current market’s hot money situation can help determine whether the current price is at its peak and whether the price of Bitcoin will continue to rise. The US M2 money supply can be used to determine the current market’s hot money situation.
2.2 Bitcoin Trend
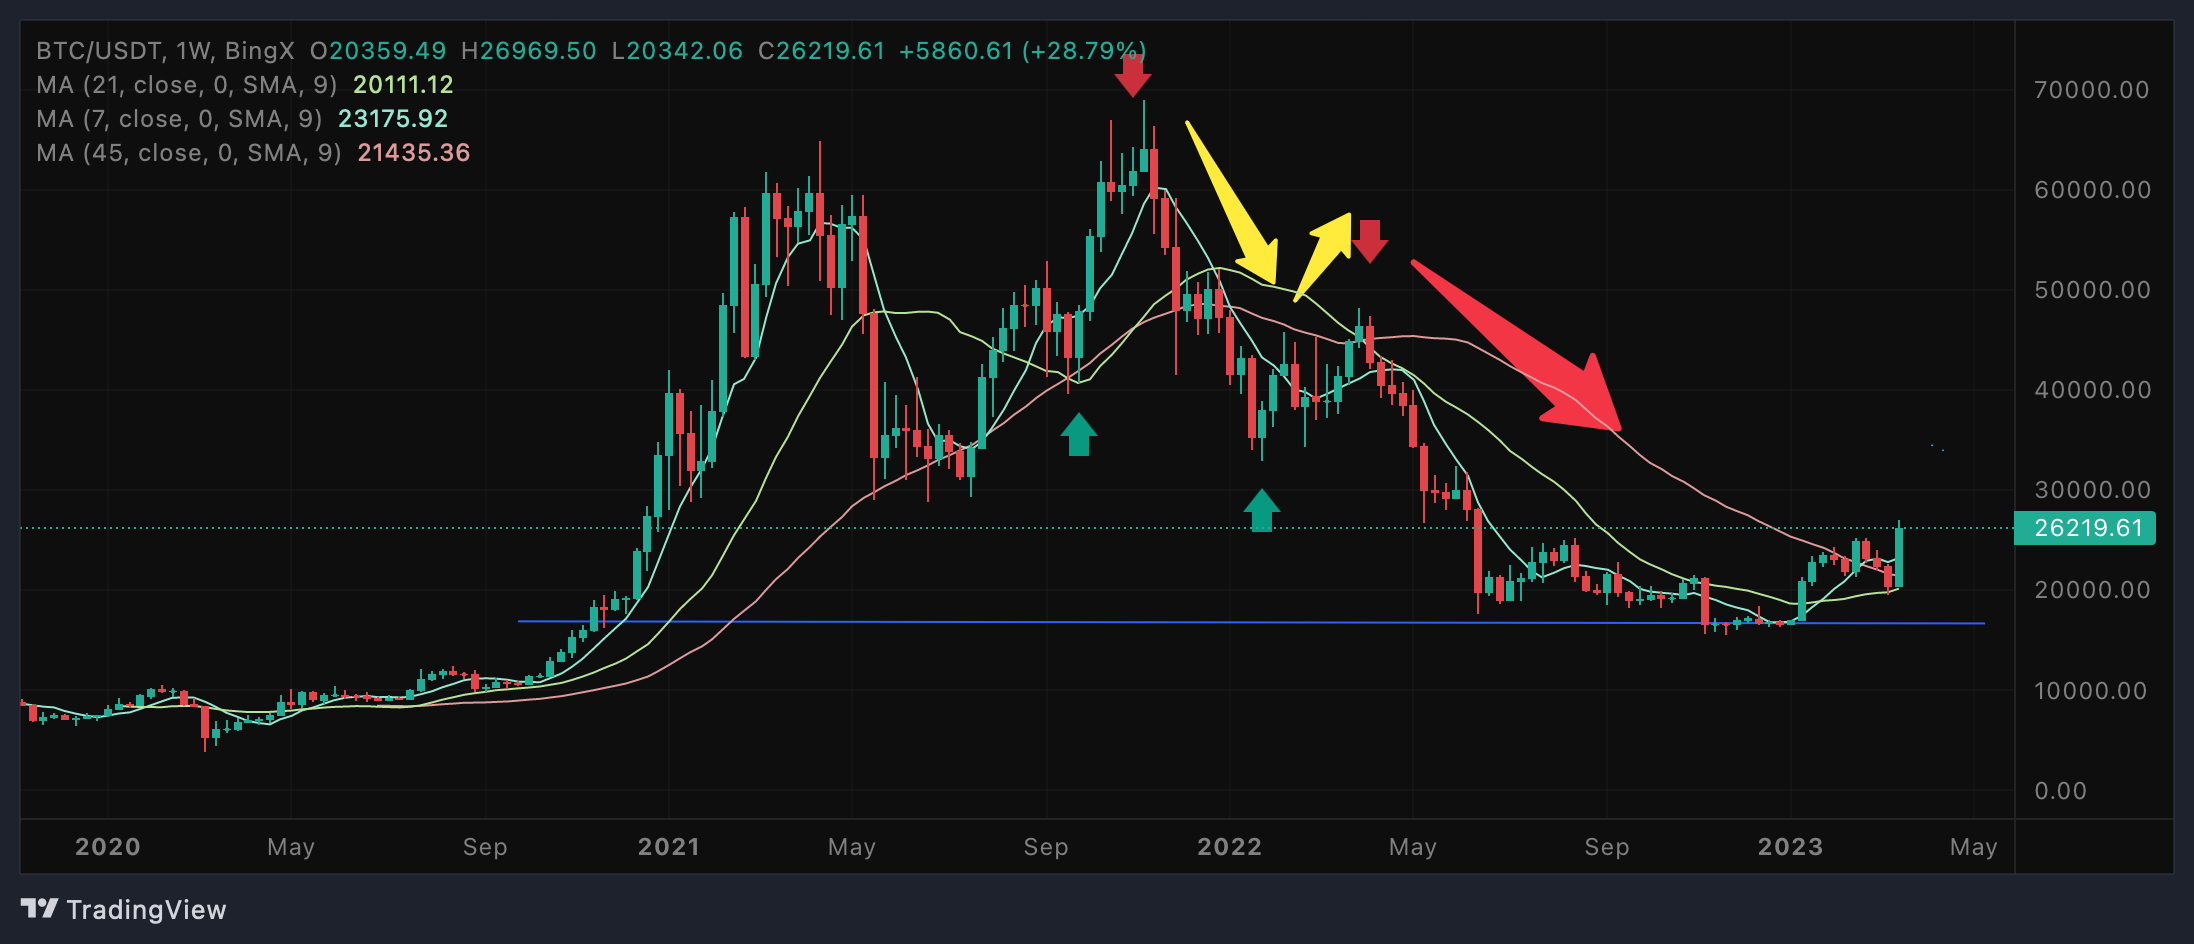
The price trend is in line with the market trend. If the current M2 money supply continues to increase, it means that the market is in a bull market. At this time, even if the price of Bitcoin falls, it will not fall much. If the M2 money supply decreases, it means that the market is turning into a bear market or is already in a bear market. Even if the price of Bitcoin rises, it will quickly fall back, forming one hook after another. The most obvious example is the sharp drop in Bitcoin around October 27, 2021. Users did not pay attention to the Fed’s tightening of hot money, which led to a decrease in the total amount of M2 money supply, resulting in being trapped at around 58,000. In the following weeks, when the price was at around 46,000, it reminded retail investors that the overall trend was already declining, but they still thought it was going up and entered the market, resulting in being trapped. Since then, the market has been falling all the way.
Looking at Bitcoin’s overall trend using weekly charts is clear. Beginners often don’t pay attention to Bitcoin’s overall trend, which is where the risk lies. You don’t need complex chart analysis, just take a quick look at the current trend and switch the chart to weekly. If the weekly chart is overall downward, the possibility of short-term upward movement is small. If the weekly chart is upward, there can only be small corrections in the short term.
If the weekly chart shows a breakthrough, and two consecutive weeks start to break through, it indicates that the market is accumulating upward momentum, which means that a bull market is about to begin. However, the beginning of a bull market does not mean that prices will suddenly skyrocket because the market still lacks hot money. Without the support of hot money, the upward movement will be weak and then oscillate in a phase. This position is the best time to enter the market because the bottom and top of the bear market cannot be determined.
Using weekly charts can also avoid more noise in market buying and selling, leading to judgment errors. When the trend is consistent with the market trend, it is easier to make trades.
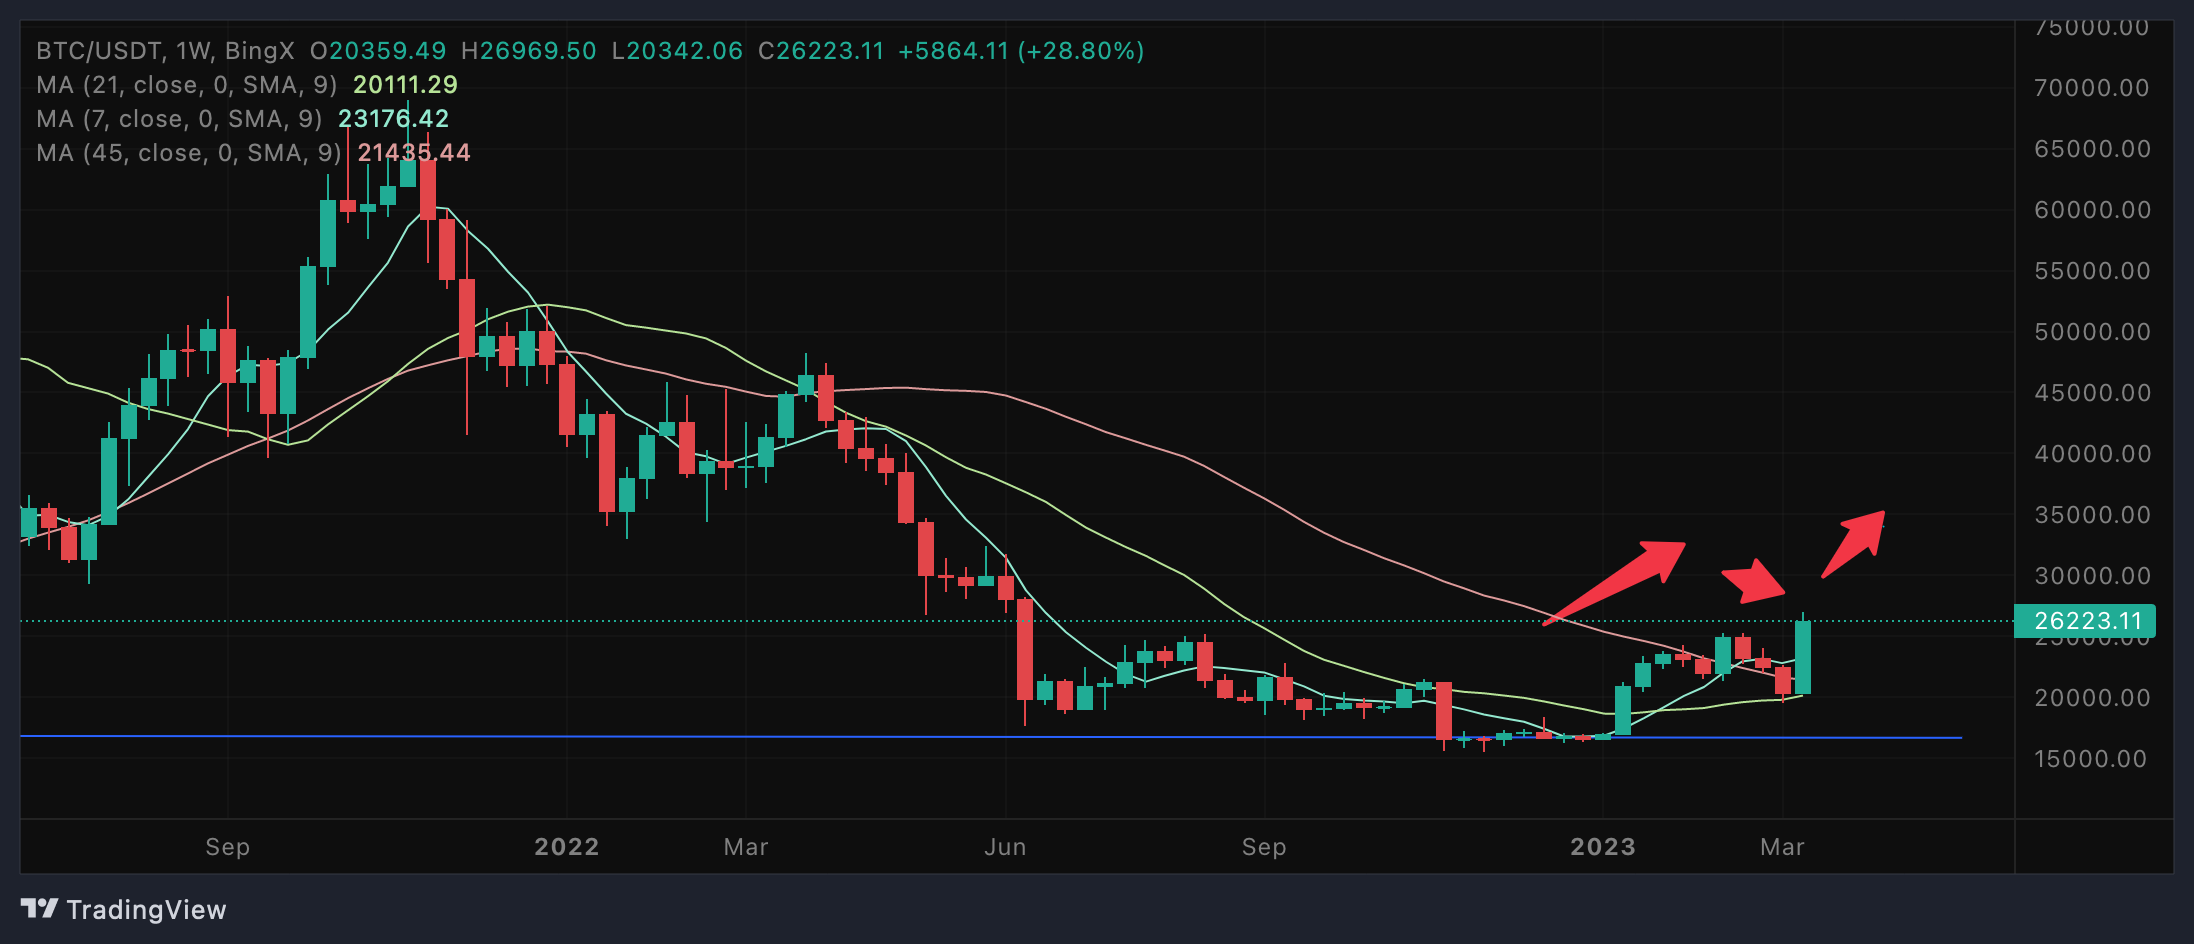
For example, the latest price of Bitcoin has quickly broken through 26,000 in the short term. In fact, three weeks ago, it was already showing that the price would break through. On January 9th, at the beginning of the year, the price rose for three consecutive weeks, indicating the bottom of the bear market and the possible formation of the beginning of a bull market. However, the beginning of a bull market does not necessarily mean a bull market, so the price will break through and then fluctuate until hot money is released, and the price starts to soar.
2.3 Determine the top and bottom based on historical data
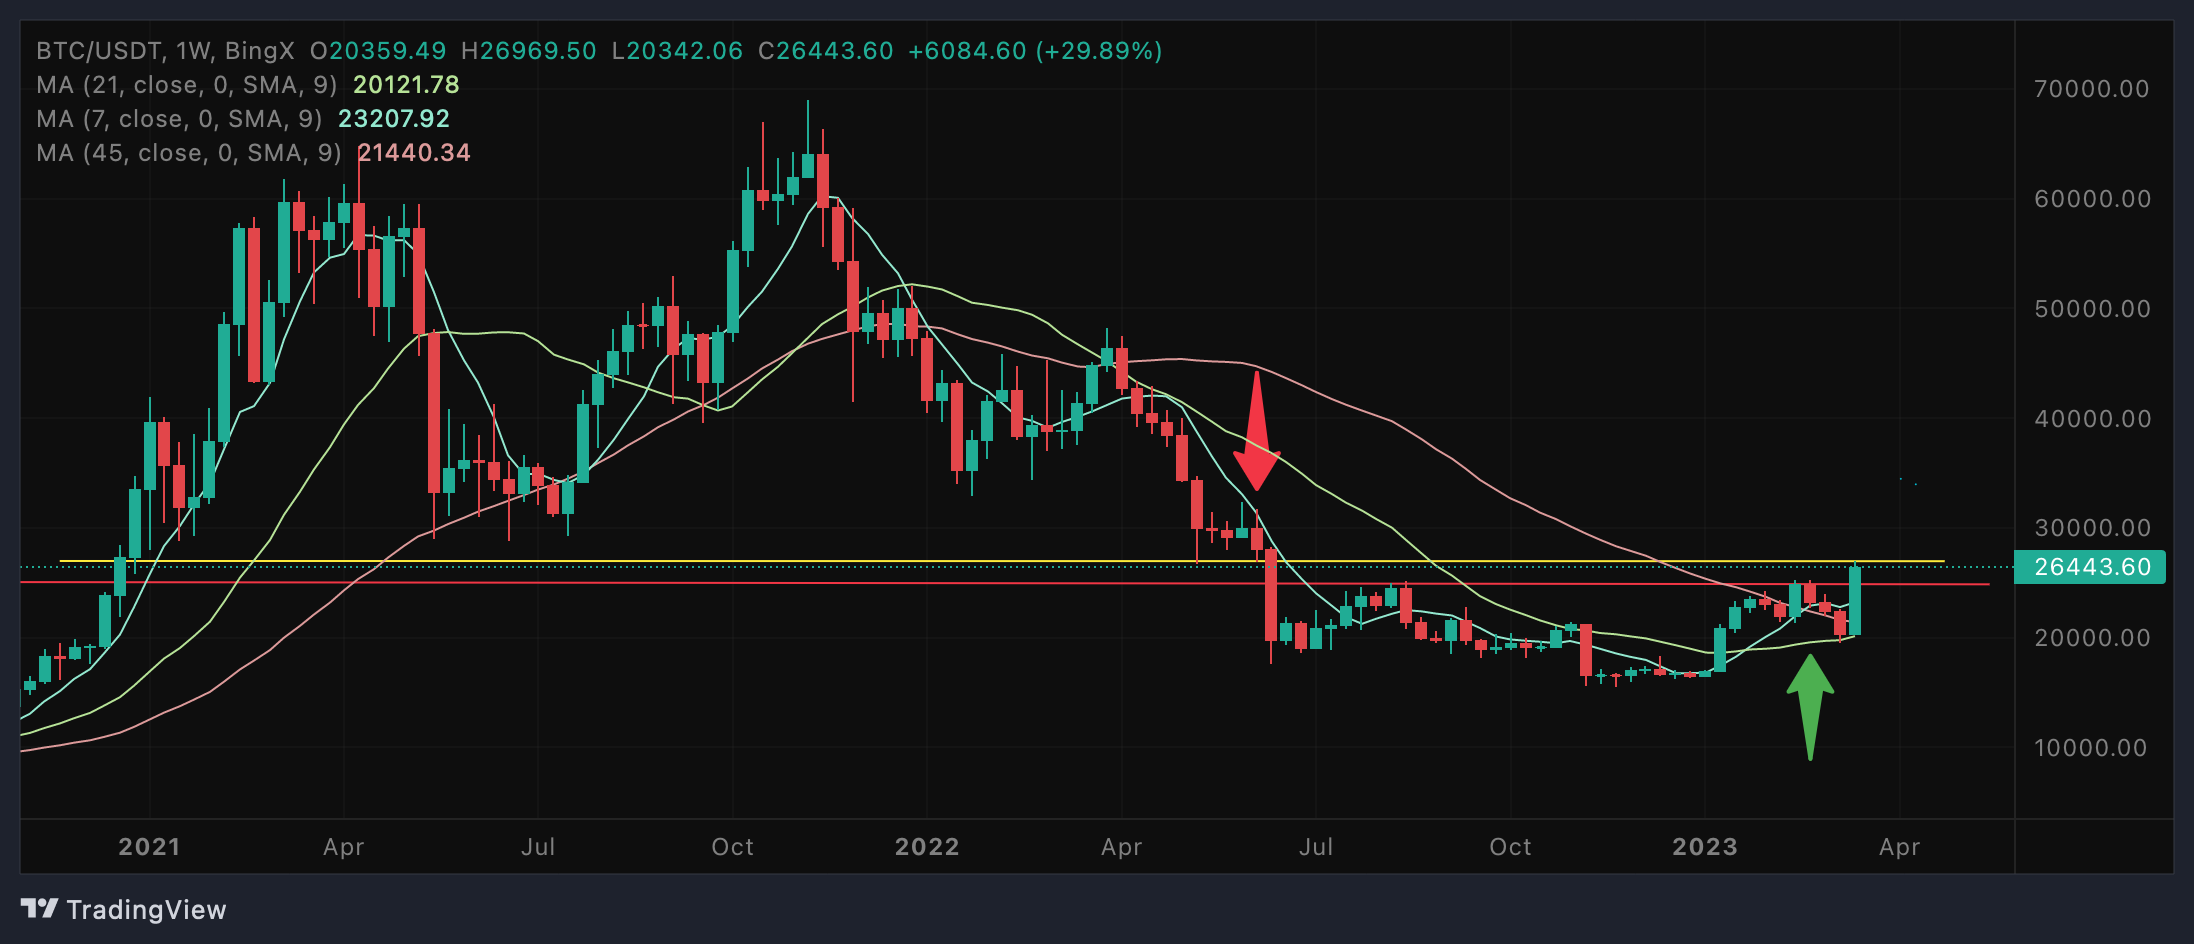
Using historical data to predict is the third step, and it still involves looking at the weekly trend. Based on the weekly trend, look at the bottom of the previous downtrend. Then zoom in to the daily trend, the bottom and top prices. For example, today BTC broke through 24,800 and all the way to 26,000. Among historical prices, around 27,000 is a bottom of a previous downtrend, which has become the top price during the uptrend. Therefore, if BTC does not break through 27,000 in the short term, the price will fluctuate around 26,000.
3. Summary of Bitcoin Price Prediction
Bitcoin price prediction starts with a broad overview of the market environment and then progressively delves deeper. First, we examine the overall market situation, studying the market’s hot money through M2 money supply, then use weekly charts to determine the trend, and daily charts to determine the bottom and top prices. Finally, we arrive at the short-term price and situation for Bitcoin. The longer the time frame, the more difficult it is to accurately predict Bitcoin’s price. For example, predicting the price one year or even ten years from now is difficult because hot money is at the core of price determination. The supply and demand relationship of whether the market has money to buy Bitcoin and how many people are selling it is complex and affected by many factors, such as political needs, war, economic stimulus, inflation, and more. When prices fall, inexperienced users often panic and worry that prices will continue to fall, while when prices rise, they often become greedy and believe that prices will continue to rise. Experienced traders, on the other hand, often buy when prices fall, but sometimes get trapped when prices continue to drop, and sell when prices rise, but sometimes miss out on further price increases. Bottom-fishing is a form of gambling mentality that cannot be sustained unless one knows when to quit, as it is difficult to determine the bottom of a bear market or the top of a bull market. Good luck in bottom-fishing once does not guarantee success in subsequent attempts, as one may lose all of the profits made from the previous attempt. Trading can only earn profits in the middle, and one can only ensure continuous income in a volatile and changing market by truly learning trading skills and market analysis knowledge.


